
Revista PODIUM, January-April 2020; 15(1): 84-98
Translated from the original in spanish
Introduction to the study of variables related to the speed of pitching in baseball
Introducción al estudio de variables relacionadas con la velocidad del lanzamiento en el béisbol
Introdução ao estudo das variáveis relacionadas com a velocidade do pitching no beisebol
Islay Pérez Martínez1* ![]() https://orcid.org/0000-0002-9011-6474
https://orcid.org/0000-0002-9011-6474
Maykel Martínez García1 ![]() https://orcid.org/0000-0002-3902-5796
https://orcid.org/0000-0002-3902-5796
Ariadna Quintana Díaz1
![]() https://orcid.org/0000-0002-6920-8761
https://orcid.org/0000-0002-6920-8761
1Universidad de Matanzas. Cuba.
*Corresponding author: islay.martinez@umcc.cu
Received: October 4th, 2019.
Approved: January 21th, 2020.
ABSTRACT
There are several variables that are considered important to achieve an increase in the speed of pitching in baseball. But coaches do not know the level of influence of these variables. The objective of the research is to establish the level of interrelationship between the main physical variables controlled in the process of sports preparation in baseball and the speed of pitching in a sample of non-players. An intentional sampling was used to select 34 students of 3rd and 4th year of the degree in Physical Culture at the University of Matanzas. Tests were conducted to measure the levels of explosive force from various muscle planes. Pearson's and determination coefficients were applied to establish the level of statistical interrelation between the variables. It was obtained that the seven variables analyzed show a statistical correlation that goes from weak, to very weak, even nonexistent, therefore, the research hypothesis is rejected.
Keywords: baseball; capacities; pitching; speed.
RESUMEN
Varias son las variables que se consideran importantes para lograr un aumento en la velocidad del lanzamiento en el béisbol. Pero los entrenadores desconocen el nivel de la influencia de dichas variables. El objetivo de la investigación es establecer el nivel de interrelación entre las principales variables físicas, controladas en el proceso de preparación deportiva en el béisbol y la velocidad del lanzamiento en una muestra de no jugadores. Se utilizó un muestreo intencional para seleccionar 34 estudiantes de 3ro. y 4to. años de la licenciatura en Cultura Física en la Universidad de Matanzas. Se realizaron pruebas para medir los niveles de fuerza explosiva de varios planos musculares. Se aplicaron los coeficientes de Pearson y de determinación para establecer el nivel de interrelación estadística entre las variables. Se obtuvo que las siete variables analizadas muestran una correlación estadística que va desde débil, muy débil, incluso inexistente; por tanto, se rechaza la hipótesis de investigación.
Palabras clave: béisbol; capacidades; lanzamiento; velocidad.
RESUMO
Existem várias variáveis que são consideradas importantes para conseguir um aumento na velocidade de lançamento no beisebol. Mas os treinadores não sabem o nível de influência destas variáveis. O objetivo da pesquisa é estabelecer o nível de inter-relação entre as principais variáveis físicas controladas no processo de preparação esportiva no beisebol e a velocidade de arremesso em uma amostra de não-jogadores. Uma amostragem intencional foi utilizada para selecionar 34 alunos do 3º e 4º ano do curso de Cultura Física da Universidade de Matanzas. Foram realizados testes para medir os níveis de força explosiva de vários planos musculares. Os coeficientes de Pearson e determinação foram aplicados para estabelecer o nível de inter-relação estatística entre as variáveis. Obteve-se que as sete variáveis analisadas mostram uma correlação estatística que vai desde fraca, até muito fraca, mesmo inexistente. As sete variáveis analisadas mostram uma correlação estatística que vai desde fraca, muito fraca, até inexistente; portanto, a hipótese de pesquisa é rejeitada.
Palavras-chave: beisebol; habilidades; lançamento; velocidade.
INTRODUCTION
In baseball, like in all sports teams, the victory can be achieved only through the contribution and efforts of the whole team (Pérez, I. Sanabria, L. & Quintana, A, 2016). In addition, for the coaches the control of the training process is paramount if they want to have any possibility of success.
The control and evaluation of the results reached in competitions, as well as the comparison of the obtained data, their valuation, and analysis, are an important part of the process of sports preparation. They constitute a valuable source of information for the conduction of training process before the competition and for the development of the strategy and the game tactics during the competition (Pérez, I. & Quintana, A. 2016).
Several articles analyze the importance that the use of the statistical results has for the game tactics during the baseball games. Among then we may mention, Pérez, I. (2018a) and (2018b); Goire, L. & Menéndez, W. (2012); Pérez, I. (2010).
The pitcher is a very important position in the defensive game of baseball. Some venture to speculate on his level of importance, assigning him about 70 percent of the chances of stopping an opponent's offense.
There are several qualities that should characterize a successful pitcher, such as the mastery of the technical elements that allow fluidity in the movements with mechanical efficiency; the development of physical abilities such as strength, flexibility, endurance and coordination; the development of psychological preparation and within it aspects such as concentration of attention, psychic tolerance, distance perception, etc.; medical variables such as the characteristics of the somatotype and body composition. All these variables will influence the manifestation of two very important aspects for a pitcher, the speed and the control of his throws.
Both control and speed are essential for a pitcher. In general, training is aimed at raising the levels that pitchers possess in these qualities. Possessing a good line does not guarantee success, but it certainly helps. A line that travels at a speed of 90 miles per hour covers the distance from the box to home in 0.42 seconds, leaving the batter a very short margin of reaction time (Perez, I. 2010). For many batters, it is the most difficult pitch to hit since it reaches home in less time than other types of pitches.
The speed of the pitch is a factor that talent managers use as a benchmark when identifying children and young people with prospects. In the opinion of most, control is something that is developed with systematic training, but speed has a high genetic component and is more difficult to improve, although it is of course improved. It is in the training sessions where you build up the fitness that allows you to reach a high state of training and also where you work on trying to maintain it as long as possible. The loads administered to the players will allow a growth of the qualities and these, in turn, will allow an improvement of the sport performance that will be translated in more speed and control.
But the questions would be: how much do these components influence the speed of the throw? To what extent the different manifestations of a physical capacity, such as strength, are going to be determinant in the speed of the throw? How important would be the somatotypical characteristics, the body composition, and the technical skill?, etc. Having an approximate idea of how much each of the variables that are worked on during training influence the speed of the throwing, and even how much they influence or condition each other, would be, without a doubt, a guide that would allow the development of more individualized preparation plans.
In baseball, as far as we have been able to access, there are no antecedents for connections between motor skills and their influence on pitching speed. In this respect, only the research developed by Pérez, I. & Fernández, J. (2007) has been found. However, in other sports, there are previous studies that address the interrelationship between motor skills.
Verkhoshansky, Y. & Siff, M. (2019) propose that in sport the following types of connections can be recognized:
Positive and negative: in the relationship of capacities, when one capacity improves the situation of others, it is a positive connection and, when it worsens it, it is negative.
Direct: characterized by the relationship between two capacities and can express any of the types of connections described above.
Indirect: they are relationships between two capacities, which are related through a third one; in them, there is a direct and essential connection between two capacities, for example: in figure 1 A and B are connected through C. This will be the most characteristic structure in the physical form (Figure 1).
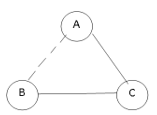
Fig. 1. - Theoretical model of an indirect interrelationship between two motor capacities.
Verkhoshansky, Y. & Siff, M. (2019)
For example, there is no direct and significant correlation between running speed and the absolute strength of a sprinter's legs. However, there is a close correlation with jumping exercises, which are also closely related to running speed. Verkhoshansky, Y. & Siff, M. (2019)
In view of the problem presented by the lack of knowledge of the level of influence that the main physical variables controlled during the process of sports preparation have on the speed of pitching in baseball, it was decided to develop a scientific study that would shed light on this question. As a first step, it was decided to use a sample of non-active baseball players; but who perform physical exercises in a systematic way and who knew the basic motor skills of baseball. These results would allow further comparative analysis with active athletes.
Following this logic, the objective of the research was defined: to establish the level of interrelationship between the main physical variables controlled in the process of sports preparation in baseball and the speed of pitching in a sample of non-players.
MATERIALS AND METHODS
The measurement of this study allowed the collection of data in the different tests applied to the students. To select the tests, we followed the criteria of using exercises that are related to activities that coaches consider important because they influence the speed of pitchers and that are commonly used during training sessions, even though the authors did not agree with these criteria.
First, the body weight and height of each member of the sample were taken. Both tests were performed barefoot and in shorts. Then a general and special warm-up was performed, focusing on the muscular planes that would play a leading role in the tests.
Then the order to apply the tests was:
Direct observation made it possible to control all the tests applied to the students. In applying the tests, the following factors were taken into account. They were developed in the morning session, the students carried out the tests with appropriate clothing and footwear. For a better organization of the tests and to be able to carry them out without losing time and without affecting the teaching process, the groups were met in advance and were informed that they would be part of an research, so they had to make the maximum effort.
The instruments used were:
Statistical techniques and procedures used
To determine the interrelationship, Pearson's linear correlation coefficient (r) was used because the variables studied are continuous. The determination coefficient (D) was also used to strengthen the result obtained in the level of narrowness of the interrelationship and to determine the percentage of variation of one coefficient with respect to another.
The sampling used was intentional because the main objective is to carry out a preliminary study that offers us a reflection or trend of the phenomenon studied, before moving on to use a sample of athletes. For the research, 34 students of 3rd and 4th year of the degree in Physical Culture at the University of Matanzas were selected.
The selection criteria used, in the selection of the sample, were:
RESULTS AND DISCUSSION
Analysis of the interrelationship between the variables measured with the throwing speed
The first of the variables analyzed in its relationship to throwing speed was the speed of travel in the 50-meter run, with high start. This test was selected because it is related to an exercise widely used by pick-up trainers. The repeated loads of speed races are used very often both in the pre-season and during the development of the competition. In tournaments such as the National Series or the championships for youth and cadets, in which they play several days a week for several months, it is common for the opening pitchers who have to work by rotation, the day before, to train, doing several repetitions of speed races of 50 meters.
Coaches consider this type of running to be important for the preparation of pitchers and that it is related to the activity of throwing because the type of energy substrate used and the intensity of the exercise are similar to the act of throwing a ball.
The dispersion of the values illustrated in figure 2 denotes a poor linear relationship between the travel speed in 50 meters and the throw speed. The values are not shown near the centerline. In addition, they show a negative trend, which is logical because of the difference in the expression of the data for the two variables. The values obtained in the correlation analysis reaffirm what is illustrated in the graph and show a mathematical interrelation of -0.42, which is classified as a weak correlation. This value shows a valid statistical significance for 0.05, which certifies the reliability of its value (Figure 2).
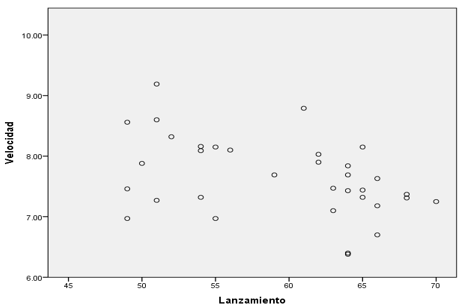
Fig. 2 - Data scatter plot between travel speeds in 50 meters and throwing speed
Pearson's Correlation: -0.421 Significant for 0.05 D = 17.72
Normally, negative values show an inverse proportional interrelationship, but in this case, although mathematically it is negative, we can qualify it as positive. The time values, when they decrease, show an increase in the speed of movement. The values of throwing speed are expressed in miles and when they increase they mean more speed. Therefore, in this case, as the speed of the race increases, the throwing speed will increase, but in a very small proportion. The coefficient of determination (D), also recognized in the literature as r2, tries to explain in what percentage the relationship between both variables is translated. In this case, the increase in throwing speed would be explained or could be influenced by the increase in race speed, by only 17.72 %.
The second test applied was that of traction on the fixed bar; this was included because its relationship with the muscles influences the action of throwing, on the biceps, the anterior brachial, the long supinator, the major round, the wide dorsal, the trapezius, the rhomboids and the deltoids. It is also a frequently used exercise in the physical preparation of the pitcher, because it does not have a high cost.
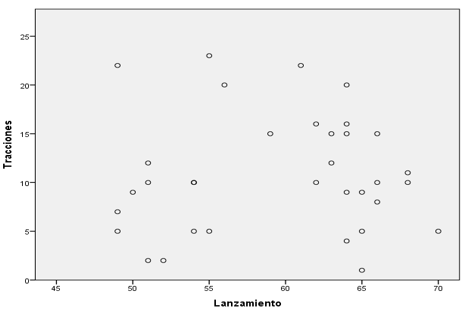
Fig. 3. - Scatter plot of data between traction and throwing speed
Pearson's Correlation: 0.038 D = 0.14
In figure 3, a large dispersion of values is shown, which shows a lack, almost nil, of statistical interrelationship between both variables. This interpretation is reinforced by analyzing the value of Pearson's coefficient of only 0.038, which, in addition, translates into only 0.14 % of mutual influence, according to the determination coefficient. These values prove the non-existence of a statistical correlation; which is contradictory to the most widespread opinion among coaches about the importance of this exercise in terms of its contribution to the action to be thrown. Although the speed of contraction and the movement performed in the exercise are not the same, the muscles that are exercised do participate when it comes to pushing the ball. Therefore, this result merits further study and with other samples (Figure 3).
The third test was the execution of the highest number of abdominal repetitions for 30 seconds. The exercise used was the trunk lift, from the floor. In this action, the major rectus of the abdomen, the anterior rectus, the major oblique and the tensor of the canine fascia were mainly involved. This test is widely used among trainers to evaluate the abdominal strength of athletes. The abdominal area is very important for the thrower; it is the center of the body in charge of the balance of the lower back muscles such as the wide dorsal, the rhomboids and the aponeurosis of the wide dorsal.
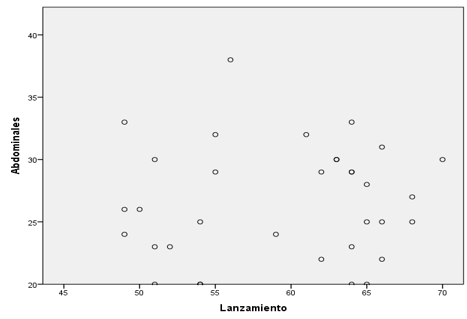
Fig. 4. - Scatter plot of data between abs and throwing speed
Pearson's Correlation: 0.072D = 0.52 %
In the case of this test, the scatter plot shows a lack of statistical correlation. Pearson's coefficient is only 0.072 which translates into a proven percentage ratio of 0.52 %. From these values and as was the case with the fixed bar traction test, no interrelationship is observed between the throwing speed and the abdominal strength test used (Figure 4).
The next variable analyzed in its relationship to throwing speed was body weight. Many coaches consider it important for pitchers to gain body weight. They rely on the physical equation F=M*A, which states that Force equals Mass for Acceleration. Following this logic of thought, if the weight increased, the speed that is imprinted on the ball would increase when it is thrown. Nevertheless, the human body, when executing a movement where force is transferred, cannot be analyzed as a simple object in movement. The human body spends more energy to mobilize one kg of fat than to mobilize one kg of muscle. It can be presumed that the same result will not be obtained, if body weight is gained by increasing fat, as if active body mass is increased.
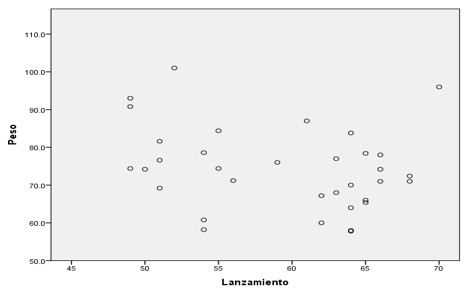
Fig. 5. - Scatter plot of data between body weight and throwing speed
Pearson's Correlation: 0.256 D = 6.55
The figure 5 illustrates a dispersion of values that shows a very poor mathematical interrelationship between the two variables. The value of -0.256 falls into the category of weak statistical interrelationship and is also negative. The coefficient of determination only represents 6.55 % of the percentage relationship. In other words, the mutual influence between the two variables can only be explained to a degree of less than 7 %.
According to these values, there is practically no mathematical correlation between the two variables. Moreover, this interrelationship is inversely proportional because it is negative. An analysis, taking into account the components of body composition, would shed more light on this issue. It would allow to correlate, separately, the active and passive body mass kg, the strength index (AKS), etc. (Figure 5).
The next variable analyzed in its relationship to throwing speed was size. An individual's height, as well as the different body dimensions, are related to the speed of the throw. The greater length of the upper extremities favors the action of propelling the ball and the lower extremities, being longer, allow greater impulse and allow the ball to be released closer to home.
This test was selected on the assumption that a high correlation would be obtained with the speed or power of the throw. The size is an element that all sports coaches, scouts, trainers, physical trainers, take into account to identify sports talents. Although it is true that in order to have a greater reliability in the result, in the future, the estimate of the body dimensions considered as important should be used and not only the size.
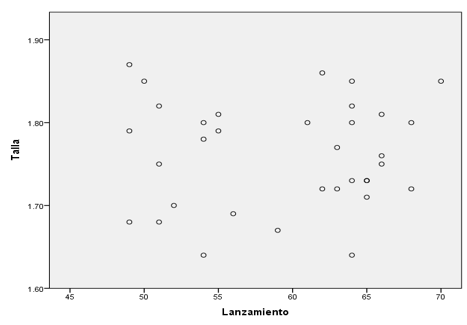
Fig. 6. - Scatter plot of data between size and throwing speed
Pearson's Correlation: 0.026 D = 0.07
As shown in figure 6, the dispersion of the values of both variables is high and moves away from the center line. This is corroborated by the result offered by Pearson's coefficient which reaches a value of 0.026. These numbers translate into less than one percent in the determination coefficient. Contradictorily to what is expected, no mathematical interrelationship is observed between both variables (Figure 6).

Fig. 7.- Data scatter plot between jump and throwing speed
Pearson's Correlation: 0.173 D = 3
The long jump without impulse stroke was a test selected for the condition of measuring the explosive strength of the legs. It was decided by this and not by the sergeant's jump, because the long jump is more related to the explosive forward movement, which the legs make when a ball is thrown. Not so with the vertical jump.
Before applying the test, the researcher assumed that he would find a high or at least medium correlation between both tests, however, as can be seen in figure 7, a very weak statistical correlation is illustrated. The coefficient of determination is only 3 %. These values are surprising because, although the muscles of the lower body are not directly involved in the drive of the ball, they are important. They act in the support of the body and in the transfer of the impulse that is acquired with the forward thrust of the pivot leg.
The last test taken into account was the two-handed shot put push. This was done with the aim of having a reference of the explosive force of the upper train. Although the implement used in the test is heavier than the baseball and was thrown using both hands, it was presumed to obtain an important correlation due to the similarity of the muscle contraction, in time, substrate and muscles involved.
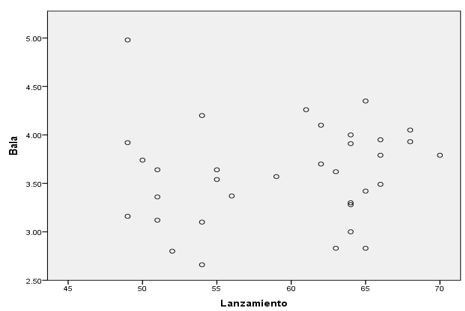
Fig. 8.- Gráfica de dispersión de datos entre la impulsión de la bala y la velocidad del lanzamiento
Correlación de Pearson: 0.096 D = 0,9 %
When we analyze the dispersion reflected in the graph and observe the Pearson value shown in Fgure 8, we find the minimum acceptable value for a very weak correlation. When taken to the percentage value of the coefficient of determination, we find less than one percent. These values are not even close to those expected when the test was decided upon. Such a result raises questions about whether these variables would have the same interrelationship when using a different sample or whether they are really important for pitcher training (Figure 8).
In a general sense, no correlation of importance was found in any of the measured variables, which raises the question of which variables truly influence and determine the speed of pitching in baseball. This opens the space for the development of more in-depth studies, with more comprehensive samples composed of active athletes, from different categories of baseball.
Finally, in Figure 9, the model of the relational structure of the variables measured with the throwing speed is illustrated (Figure 9).
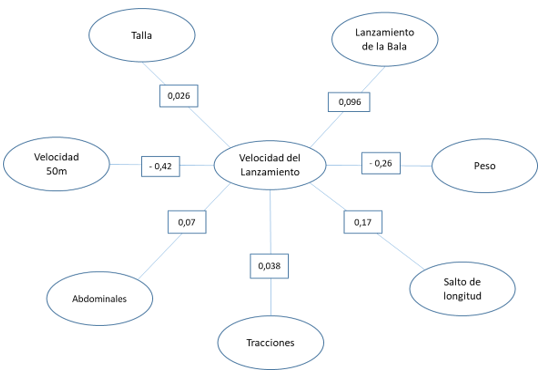
Fig. 9. - Relational structure of the variables measured with the throwing speed
The literature related to the subject under study, to which access was obtained, shows coincidence of criteria regarding the importance of the development of physical capacities and, in particular, explosive force for the increase of the throwing speed. Height, weight, body composition, somatotype and correct technical performance are considered by most authors as determining factors.
Tabla 1. - Correlation between variables
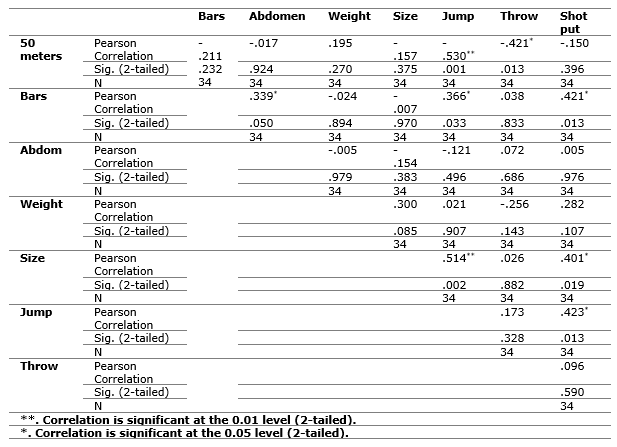
The seven variables analyzed show a statistical correlation ranging from weak to very weak, even non-existent; therefore, the research hypothesis is rejected. The variable travel speed had a proven percentage relationship of 17.72 %, a value of mutual influence that is very low. In the remaining cases, it was even lower, none of the values reached 7 % and in several cases it was less than 1 % (Table 1).
REFERENCIAS BIBLIOGRÁFICAS
Goire, L. & Menéndez, W. (2012). Análisis crítico extraído de las evaluaciones estadísticas incidentes en el ineficiente juego de los equipos participantes en el béisbol Nacional Cubano en la actualidad. Lecturas, Educación Física y Deportes, Year 17, Number 170. Consultado: 14 de Mayo 2019. Recuperado de: https://www.efdeportes.com/efd170/evaluaciones-estadisticas-en-el-beisbol.htm
Pérez, I. & Fernández, J. (2007). Introducción al estudio de variables relacionadas con la velocidad máxima del lanzador de béisbol. Tesis en opción al título de Licenciado en Cultura Física. Facultad de Cultura Física de Matanzas.
Pérez, I. & Quintana, A. (2016). Mathematical coefficients for the control of the sports performance of the baseball players during the games. Academic Journal of Science. 06, (01) ISSN: 2165-6282. Consultado: 12 de mayo 2019. Recuperado de: http://www.universitypublications.net/ajs/0601/html/B6R119.xml
Pérez, I. (2010). Formas más utilizadas en la actualidad para el control del rendimiento competitivo en el béisbol. Matanzas. Monografías Universidad de Matanzas. ISBN 978-959-16 1326-4. Consultado: 22 de abril de 2019. Recuperado de: http://monografias.umcc.cu/monos/2010/CULTURA%20FISICA/mo1026.pdf
Pérez, I. (2018a). Fundamentos de la táctica defensiva en el béisbol. 1ra. Parte. Matanzas. Monografías Universidad de Matanzas. ISBN 978-959-16-42356. Consultado: 29 de abril 2019. Recuperado de: http://monografias.umcc.cu/monos/2018/FCF/mo18144.pdf
Pérez, I. (2018b). Fundamentos de la táctica defensiva en el béisbol. 2da Parte. Matanzas. Monografías Universidad de Matanzas. ISBN 978-959-16-4235 6. Consultado: 29 de abril 2019. Recuperado de: http://monografias.umcc.cu/monos/2018/FCF/mo18145.pdf
Pérez, I. Sanabria, L. & Quintana, A. (2016). Análisis de la efectividad en los lanzamientos de los lanzadores del equipo de béisbol sub-15 de la provincia Matanzas en el Campeonato Nacional 2014. EFdeportes.com. Year 20, Number 212. Consultado: 14 de mayo 2019. Recuperado de: https://www.efdeportes.com/efd212/efectividad-en-los-lanzamientos-de-beisbol.htm
Verkhoshansky, Yuri & ZIF, Mel C. (2019). Súperntrenamiento. 2da. Edición. Editorial Paidotrivo. Colección Deporte & Entrenamiento. ISBN: 9788480194655. Recuperado de: http://www.paidotribo.com/entrenamiento-deportivo/497-superentrenamiento.html
Conflict of interests:
The authors declare not to have any interest conflicts.
Authors' contribution:
The authors have participated in the writing of the work and analysis of the documents.
![]()
This work is licensed under a Creative Commons Attribution-NonCommercial 4.0 International license.
Copyright (c) 2020 Islay Pérez Martínez, Maykel Martínez García, Ariadna Quintana Díaz